Have you ever sold anything? Old books, your bike car or even your house? Whether you did that using a garage sale, on eBay or even using more advanced technology like Zillow what did you feel right after the sale? – “I could have raised the price another 10% and the dude would have still bought it”. “Dang! Why did I throw in my comics for free with the sale”. Or “oh my god I didn’t sell this bike just because I didn’t reduce my price by $10. It’d have been good riddance”.
Well, that’s just the nature of sales and pricing. Now imagine the plethora of players in the value chain of any industry like Entertainment & Hospitality :
- Distributors like Kayak, Expedient, etc.
- GDS’s like Worldspan, Sabre, Amadeus
- Operators like Contiki, Pleasant Holidays, etc.
- Consolidators like Pegasus, Trust, etc.
The consumer is willing to pay only so much depending on the product, the season, her expectations, different bundling of products. But all these players lead to so many types of rates for the same room: Published, Negotiated, Packaged (Expedia), Opaque (e.g. LastMinute, PriceLine), and Restricted. Of course, like any pricing strategy, there is a stark dependency on so many variables: demand patterns, channels, competition, etc. Imagine a hotel or vacation club that offers rooms – different destinations, different experiences (Jacuzzi, etc.); Services included (a jet ski tour), Security, additional room types, etc.
The basic problem is as depicted below:
The only options management has are:
- reject demand
- inventory excess demand (queueing)
- modulate capacity (add facilities, scheduling, resource allocation)
- modulate demand (pricing, yield management)
In the Hospitality industry, there is a detailed science behind this pricing and demand fulfillment. This is to really be able to maximize the revenue. It’s called Revenue Management or Yield Management.
The idea is two-fold: Have a market segmentation strategy (capture consumer surplus) and match price to demand (peak-load pricing). So airlines sell First class, Business class, economy class etc. Hotels create suites, single rooms, double rooms, etc. and price the products differently. Intelligently allocate fixed capacity to products. Also then allocate more capacity to low price points if demand is weak; allocate more capacity to high price points if demand is strong. Ever wondered why flights are always over booked and over sold.
Hotels, travel agencies, airlines, vacation clubs, car rentals, theatres, sporting venues, and other industry players are even unlocking the power of Big Data to enhance revenue management. That’s why this is a cycle of these activities and combines a lot of science with the art of pricing. Providers recognize that data analytics are helpful in establishing the optimal price for their products – the right price to the right customer at the right time. The basic algorithms are as below:
- Segmentation/product design – discriminate (sort) customers based on their actual willingness-to-pay (reservation price). Since the willingness to pay is tough to find for all customers, they try to find a variable that is correlated with willingness-to-pay (a “sorting mechanism”). Advance Purchases are encouraged.
- Forecasting – factor in seasonality, trends, truncation (reservations accepted vs. potential demand), special events, promotions, etc.
- perfect forecasts (deterministic)
- uncertain forecasts (stochastic)
- Capacity Allocation – evaluate the opportunity cost (displacement cost/bid prices) of using resources required to meet current demand. So accept the current request if Revenue is greater than Displacement Cost. Most companies have to rank demand from highest revenue to lowest
- allocation: highest revenue classes first
- displacement: lowest revenue classes first
- Control – Try to control demand and prices by ad-hoc negotiation, “posting” remaining availability (reservation system booking limits), open/closed status indicators, bid prices/hurdle rates, etc. Ultimately, it boils down to an accept/deny decision for each service request.
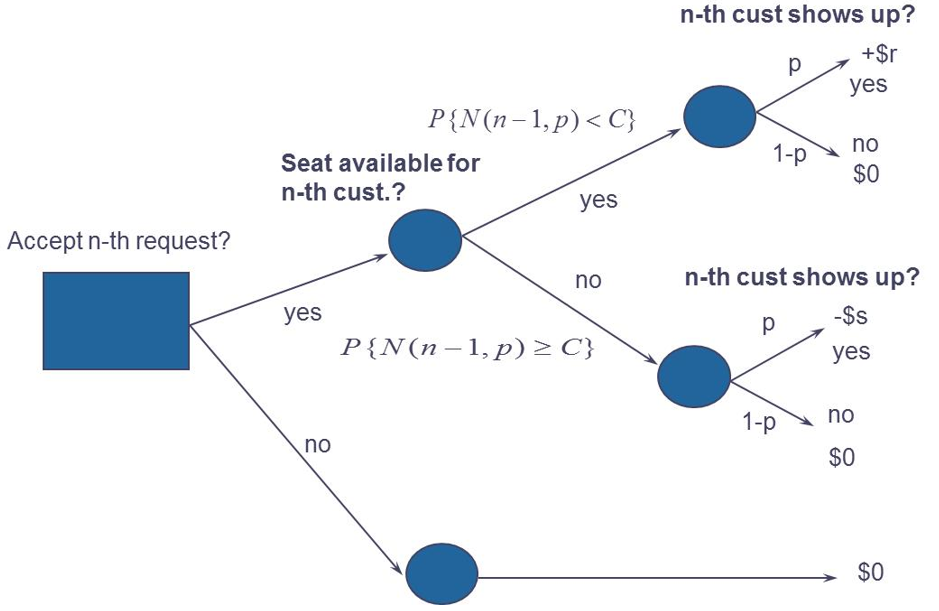
This is where statistical tools and big data help. An example of a tree function for marginal revenue analyses for overbooking a flight, for example, is as below:
| C | capacity of flight |
| p | probability that the reservation shows up |
| r | revenue from booking seat |
| s | cost of denied boarding (free flight, goodwill) |
In a nutshell, the business can be described as:


