by Scott Chesney & Thomas Clarke –
It is shocking just how long some solutions take in this supposedly fast-paced world. In the past, solutions to common problems would often take significant amounts of time, evolving slowly towards a more efficient answer. The common household screw, for instance, is believed to have been invented around 400BC as a means to press olives. But the first screw used as a fastener wasn’t invented until the 1500s and required a wrench. And screwdrivers only arrived 300 years after that. In many of today’s companies, it takes far too long to have basic business questions reliably answered by analysis of data that already exists within the company’s walls. Answers and insights that require historical analysis combined with current data often take weeks or months to determine. This should not be the case.
Common challenges to getting transformative, valuable analytics up and running in today’s companies are:
- Messy data
- Data in a bewildering array of silos and formats
- Limited data governance but strict enterprise architecture policies
- Lean IT departments
- Limited data management skills
- Inexperience with current cloud, big data, and data science technologies
Getting to the data that is currently “trapped” in our systems or databases can be the first major hurdle. Once accessed, it can be difficult to safely cleanse, assess, link, and organize to an analyzable state. Finally, major transformations are often needed to aggregate and summarize the data into a consumable form. All this before proper analysis can begin. Luckily, there are new tools and techniques to address this problem and get to the analytic stage quickly; possibly in as little as five days and certainly much faster than legacy approaches.
What exactly are we analyzing?
To appreciate the challenge, ask “What business problems are we trying to solve?” Before diving straight into an effort to grab data elements buried in current systems and wrestling them into submission in a new analytics solution, we need to understand the business questions and why the answers are not yet known. The systems that currently house the data probably already provide ways to view and investigate that data. But often these systems either do not contain all the data necessary or restrict the way data can be combined or consumed.
Most business questions are notoriously tricky. When asked, “who is likely to buy our products?” multiple possible analytics can be created to provide an answer. A small sample of these might be:
- Order or market basket analysis
- Customer intention and retention analysis
- Marketing program effectiveness
- Market penetration
- Social media penetration and perception
Each of these options can answer the initial question but will invariably lead to additional questions. An order analysis alone won’t answer the question without follow-on consideration of demographics, brand awareness, and the competitive landscape. Try to identify the full potential scope of inquiry before investigating and consolidating data elements.
Quick-Start Environments
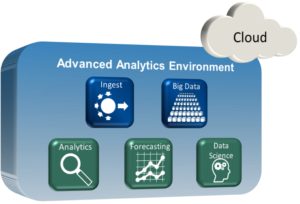
The most common method of dealing with data from multiple systems and leveraging current data stores in new ways is to identify a new environment to accumulate various data subject areas that have a high likelihood of contributing something to the business answers. To ensure a quick setup, we need to look beyond the internal, long-lead time, on-premise procurement efforts in most companies. Leveraging today’s cloud technologies with fully integrated security solutions allows for the immediate environment setup and flexible configuration.
(click image to enlarge)
These cloud environments and cloud providers allow for various self-service models. If you have the desire and skills to manage the entire configuration yourself, then you simply get the platform-as-a-service option. If you need assistance in setting up and managing the environment, then there are multiple options, including experienced firms like RCG to provide this full-service environment capability. With the right expertise, a cloud environment can be spun up in minutes, properly configured and secured in hours and have data loads underway by the end of day one.
Compressing the Time to Analysis
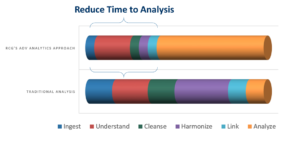
Once the environment is established and secured, the key data must be procured and prepared. Data preparation has historically taken most of the time in any data analysis effort. The timeframe for these tasks are heavily dependent on the following key factors:
- Types of data stores and data format
- Initial quality of the leveraged data
- Maturity data governance processes
- Barriers to source data access
- Limited understanding of what data is used in what business function
- Data classification and categorization
Any data preparation effort follows these stages:
Ingest:
Traditionally, it was difficult to efficiently bring together data in disparate systems to a single location. With data warehouses and data lakes, many organizations have already consolidated key data components in common repositories. If datasets are available from these sources, ingestion time can be significantly reduced. Alternatively, many companies have initiated semantic layers, using tools built on graph database technologies to model complex relationships of data elements and virtualize access to disparate data sources via a common access mechanism.
Companies that still have multiple siloed source systems and lack a high-quality data warehouse or data lake need to implement a data analytics ingestion strategy. Many traditional ETL tools have evolved to handle common ingestion mechanisms and some allow for simple drag and drop ingestion data flow designs. Such tools solve the problem, but often still require extensive development effort, are typically expensive, and frequently require dedicated local hardware. Even better, in a cloud-based Hadoop solution, an ecosystem of low-cost or free data connection frameworks, like the RCG|enable Data Framework, provide simple, flexible, and performant data collection, ingestion and transformation.
Agile Analytics spends very little time on the ‘plumbing’ of the infrastructure or traditional ETL approaches to loading all possible data and instead moves to identifying the highest value data, ingesting it, and starting to understand it.
Understand:
To accomplish any meaningful analysis of the data, data architects and analysts must understand the lineage and properties of that data. Where is this data created, and by what key business process? What, exactly, does it measure? How accurate is it? What was it intended to be used for?
Understanding the data is the one stage of data prep that cannot be hastened. Depending on the business questions being asked, it may be necessary to spend additional time on this portion of your data prep. There are, however, many new tools, like Trifacta1 that help you see more of your data at one time and provide sophisticated profiles of data beyond simple data characteristics and common quality measures. Some new features include identifying unusual data patterns that could uncover unknown exception processes in known business data flows, integrated master data management processes that help identify potential matches across datasets and subjects. These tools can provide quicker ways or unique ways to visualize issues, but require investigation into current business models, policies, and processes to truly understand why the data is what it is.
Agile Analytics spends time understanding the data but saves time by prioritizing which data to understand and by using tools that automate and speed the data review.
Cleanse:
Data cleansing has come a very long way. There are now plenty of visualized data management solutions, like Talend Data Prep2, that will help you build recipes for transformations and visualize resulting data sets without any coding whatsoever. Simple user interfaces and complex data profiling techniques will make identifying common data quality issues very straightforward and can save significant time.
Some data cleansing problems, however, are far deeper than basic data quality issues. Changes to business rules or new systems implementations may cause data problems that require careful analysis and significant data massaging. Historic data may be completely unavailable beyond some implementation or release point, but the remaining data is critical to providing insight to the business question being analyzed. Approaches to determining how these data gaps will be addressed can require more complex business decisions.
Agile Analytics again uses prioritization and business stakeholder involvement to do what cleansing is required and saves time using current tools.
Harmonize:
Harmonization is the alignment of various data elements to one another across different source systems and formats and to common structures like hierarchies or timeframes. It is often a challenge to data analysis, but by defining key data standards upfront and planning the harmonization of each new ingested source, many issues can be avoided. Good data governance processes in an organization pay significant dividends at this stage of data prep. If the organization has not fully implemented a data strategy or data governance approach, this is the time to draw a line in the sand and at least start by developing some initial standards and conventions.
In agile analytics projects, the focus is always on business needs and questions. If the business wants to know more about customers, then subject areas related to customers should have common standardized elements that can be mapped out ahead of time. It is not critical to get this perfect at the start but be prepared to restructure and refactor later. Focus also on operationalizing transformation designs so that everything is developed first as a repeatable, automatable, schedulable process. Externalize as many of the rules as possible to allow for single points of change to recreate the structures and ensure that a layered approach is used to distinguish final analysis areas from interim transformation areas.
Link:
Linking data is often thought of in the context of data warehouses or ERP type systems. It develops and enables new data structures that bring together multiple data sets, often in more than one way. Roll-ups, aggregations, time-forward and time-backward metrics all help resolve complex business solutions by putting key data close together and easily searchable. Many common business problems require many attributes of a customer, a purchase or other object. Although it is difficult for a user to directly consume, imagine scrolling across hundreds of columns of metrics, linking data in this way at the core data structure level can make eventual analysis and visualization far easier to develop.
In an agile approach, the high-value data is already harmonized, and a linking approach has been decided. Actual linking data happens on an as-needed basis, following established patterns and conventions.
Putting it all together:
Combining the techniques and new tools across all stages of data prep is the key to dramatically reducing the overall time-to-analysis.
Agile analytics does not seek to apply these methods to all enterprise data at once. Instead, it ensures that the highest value data gets quickly but thoughtfully ingested, understood, cleansed, harmonized, and linked so that it is ready for advanced analysis when the business needs it.
(click image to enlarge)
Optimizing Analysis
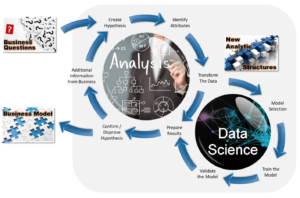
Everything to this point has been about getting quickly to the high-value phase of analysis. This is where business questions get answered. The analysis effort is dependent on the complexity of the business problem. Analysis is inherently iterative, producing and refining business insights as previous answers change the questions. A constant loop of question, hypothesis, model training and testing, and validation against the hypothesis is well suited to agile principles as long as the scope of each iteration is assessed and controlled and the topics of each iteration are continually prioritized with the business.
(click image to enlarge)
Answering large complex problems takes large complex efforts. In most cases, however, these challenging problems are just a collection of smaller issues that build up to a tangled, unmanageable mess of possible reasons and contributing factors. Agile analytics addresses the business system dynamics in smaller chunks and additively contributes to the holistic business model. This core business model set can then be easily extended to address each new analytical query without significant or redundant model development.
Summary
The keys to success in delivering agile analytics in as little as 5 days are to focus on:
- Leveraging new quick-start, cloud-based environments
- Compressing the time to analytics by using new tools and approaches to facilitate efficient data prep
- Investing in understanding the data and in adopting good practices around data governance and management
- Working closely with business stakeholders to prioritize data to ingest, understand and analyze
- Breaking down analysis complexity by incrementally building up to key business models
In the future, maybe analysis in days will no longer be the goal. We are working with artificial intelligence and deep learning processes to discover, analyze, and make recommendations to business problems we do not even know we have. But for now, agile analytics provides focused business insights and value much more rapidly than any previous approach.
#IdeasRealized
Works Cited
1. Trifacta https://www.trifacta.com/
2. Talend https://www.talend.com/products/talend-open-studio/


